The Psychiatric Physician Assistant Workforce in Nebraska: 2020 to 2024
Purpose
BHECN utilizes data from the UNMC Health Professions Tracking Service to determine the number and type of licensed behavioral health professionals who practice in Nebraska. This data snapshot includes information about the psychiatric Physician Assistant (PA) workforce from 2020 to 2024.
PAs practice medicine under physician supervision. PAs conduct medical histories and physicals, perform psychiatric evaluations and assessments, order and interpret diagnostic studies, and establish and manage treatment plans, which include prescribing medications and ordering referrals as needed.
Key Findings
- The Nebraska psychiatric PA workforce grew 57% from 2020 to 2024.
- The number of psychiatric PAs increased in 3 of the 6 Nebraska Behavioral Health Regions, though most remain concentrated in urban areas of the state.
- All 4 PA programs are in urban settings, although UNMC also has a rural campus site.
- Nebraska does not offer residency programs for PAs to gain expertise in psychiatry.
Regional Trends
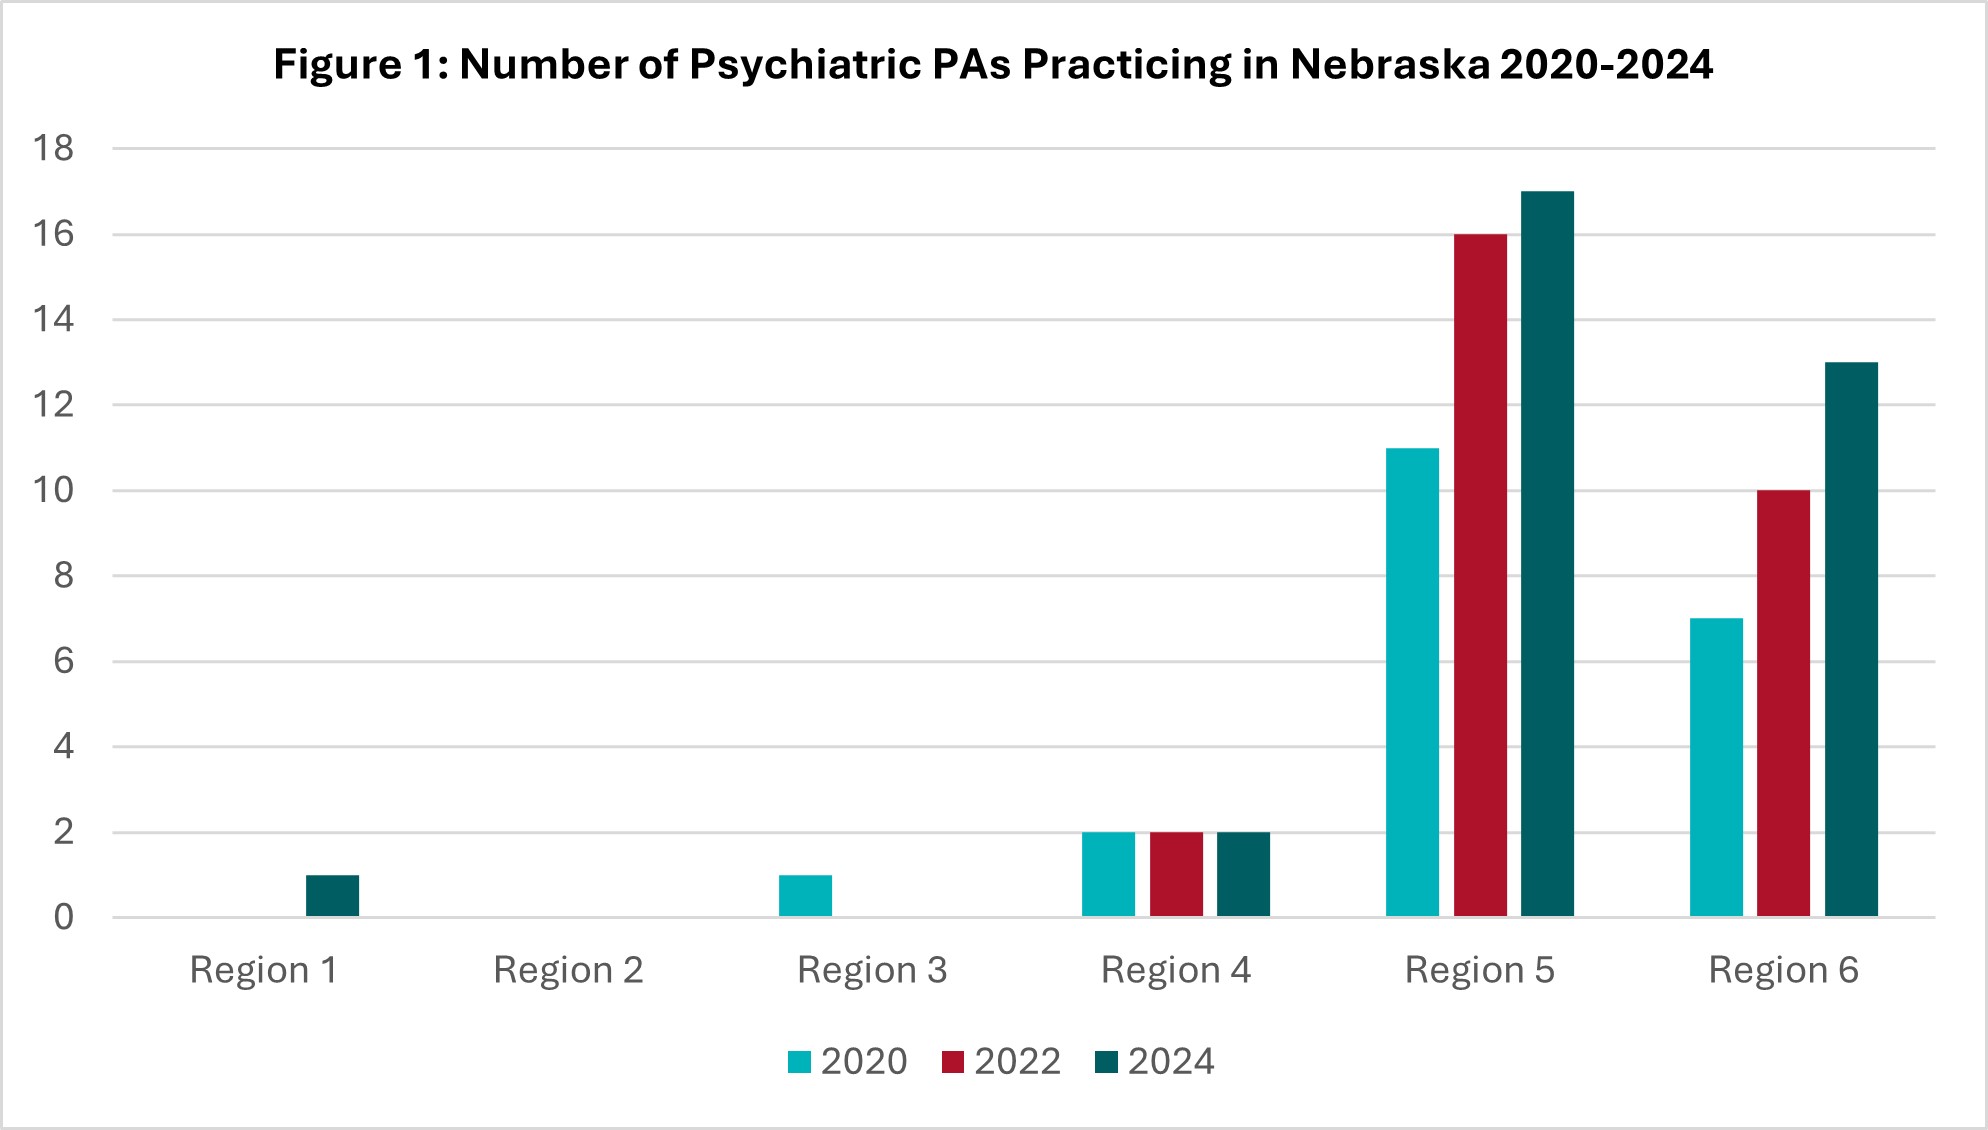
The number of psychiatric PAs practicing in Nebraska increased 57% from 2020 to 2024 (from 21 to 33). The number of psychiatric PAs increased in Nebraska Behavioral Health Regions 1, 5, and 6, remained stable in Regions 2 and 4, and decreased in Region 3 (see Figure 1).[1]
Rural and Urban Distribution of Psychiatric PAs
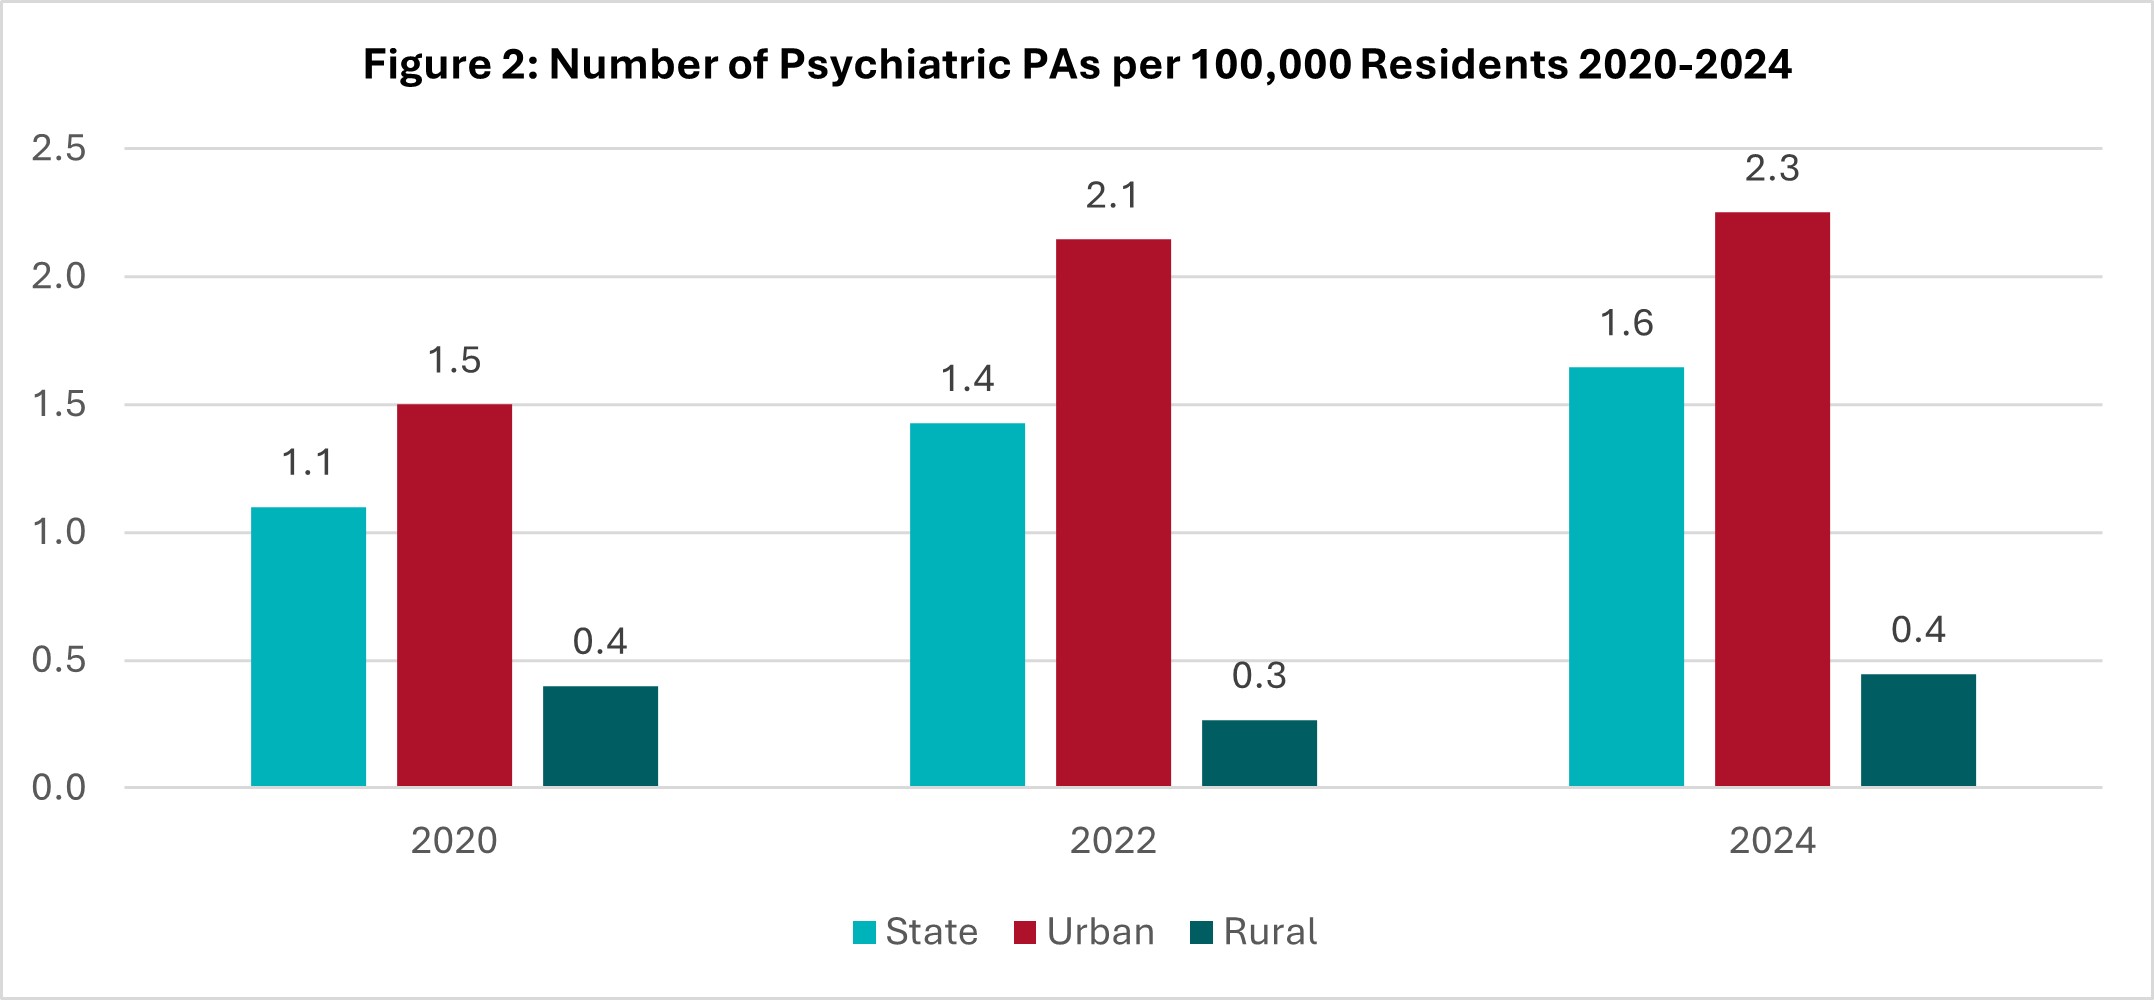
The number of psychiatric PAs per 100,000 residents in rural areas has remained stable since 2020, but rural areas still have significantly fewer psychiatric PAs per 100,000 residents compared to urban areas (see Figure 2). At 0.4 psychiatric PAs per 100,000 residents, Nebraska rural counties are below the national average of 0.95 psychiatric PAs per 100,000 population.[2]
Age of Psychiatric PAs
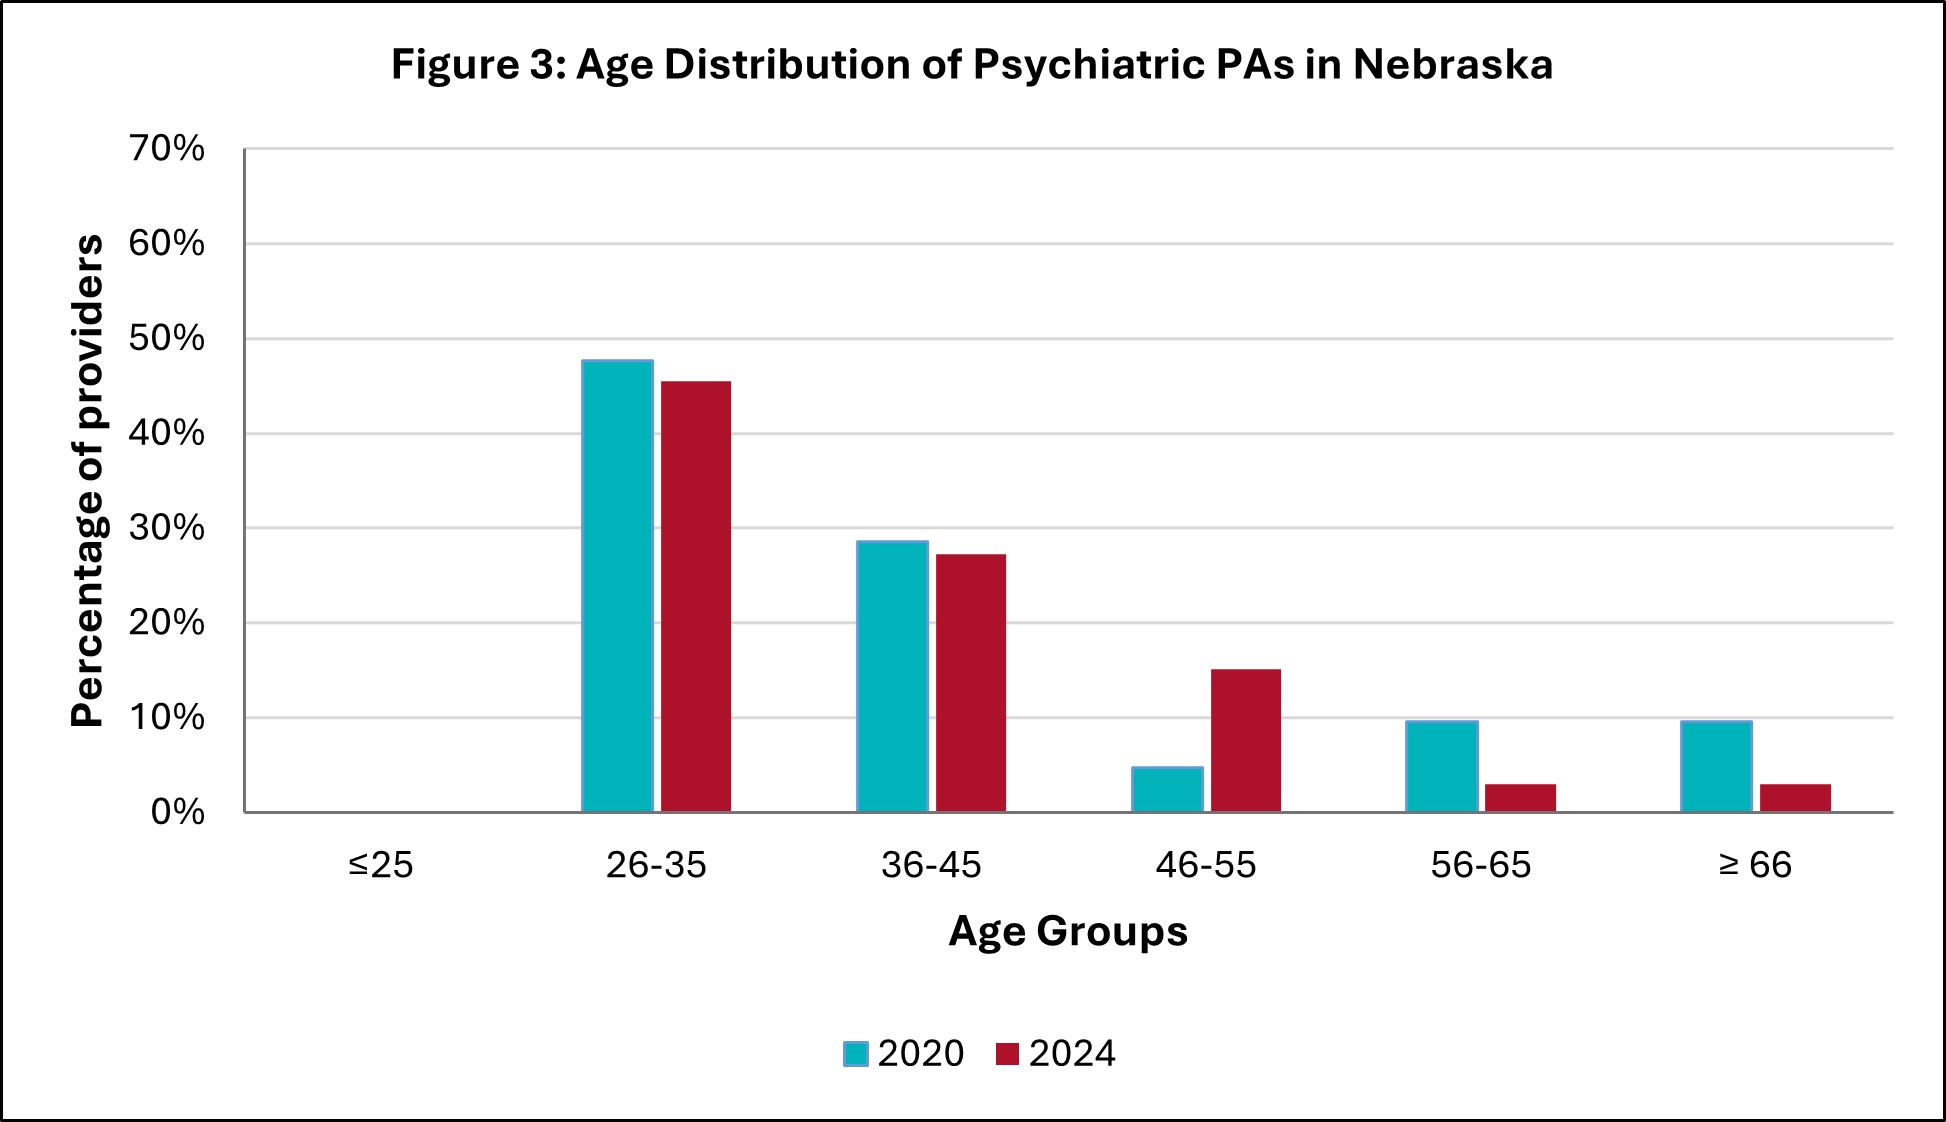
Since 2020, the number of psychiatric PAs at or nearing retirement age has decreased. The number of psychiatric PAs aged 26-45 has also slightly decreased (see Figure 3).
Psychiatric PA Training Programs
PA education takes six to seven years to complete (an undergraduate degree plus a 24-33 month Master’s degree). There are four PA programs in Nebraska: Union Adventist University in Lincoln (started in 1997), Creighton University and College of St. Mary in Omaha (started in 2019 and 2016, respectively), and the University of Nebraska Medical Center in both Omaha and Kearney (started in 1973 & 2015, respectively).
PAs are trained in a broad range of medical specialties, including primary care, and can receive additional education in providing psychiatric-specific care through post-graduate continuing education, on-the-job learning, and mentoring. PAs in Psychiatry can also earn the Certification of Additional Qualifications in Psychiatry (CAQ-Psych) from the national certifying body. Some states offer residency training programs in psychiatry for PAs, though no such program is currently available in Nebraska.
Conclusions
The Nebraska psychiatric PA workforce has grown since 2020, and numbers exceed the national average per 100,000 population in urban areas. Still, the profession faces significant challenges, including limited training programs, a lack of residency opportunities in Nebraska, and a small number of providers in rural areas.
Suggested citation:
Behavioral Health Education Center of Nebraska. (2025). The Psychiatric Physician Assistant Workforce in Nebraska: 2020 to 2024. https://www.unmc.edu/bhecn/research-data-policy/2020_2024_pa_snapshot.html
Footnotes
[1] Nebraska Department of Health and Human Services. (2025). Behavioral Health Resources for Schools: Division of Behavioral Health. https://dhhs.ne.gov/BHSchoolResources/AboutDBH.pdf
[2] National Commission on Certification of Physician Assistants (2024). Statistical Profile of Board Certified PAs by Specialty, annual report. https://www.nccpa.net/wp-content/uploads/2025/08/2024-Statistical-Profile-of-Board-Certified-PAs-by-Specialty.pdf